


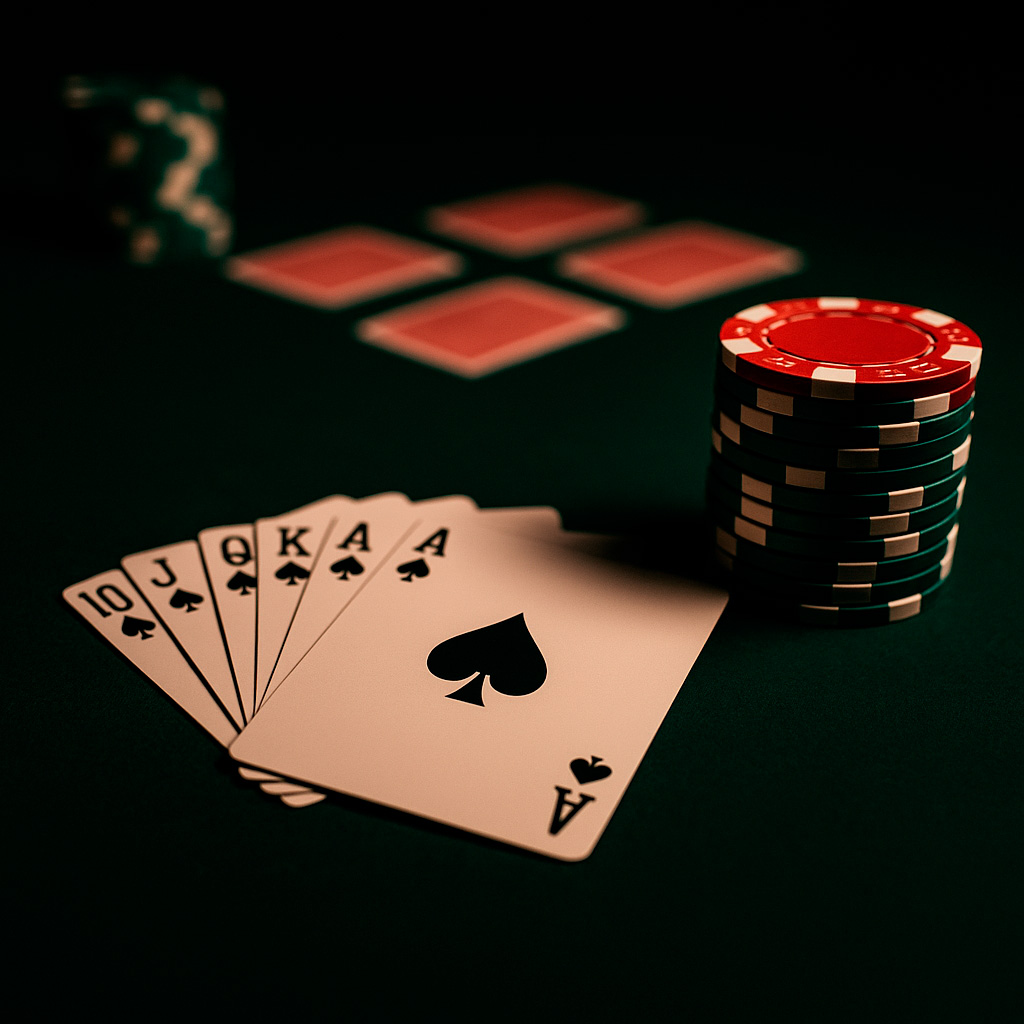


Poker Preflop decisions define your entire session before a single community card appears. Most recreational players hemorrhage chips on hands that statistically never had a shot at winning — and they never figure out why. A structured chart doesn't just dictate what to play; it trains your instincts around which hands carry real equity and which quietly drain your stack. At Shazam Casino, this foundation is what separates break-even grinders from players who consistently cash.
Preflop poker charts map every two-card combination into a 13×13 grid — pocket pairs on the diagonal, suited hands above, offsuit below. Each cell delivers a precise instruction: open-raise, fold, or 3-bet. Once you decode this layout, the chart becomes a readable language rather than a confusing spreadsheet.
Your position at the table reshapes every preflop decision you make. Acting first from UTG means zero information — so your range contracts sharply. By the button, you've processed every opponent's action before committing a single chip. A tight-aggressive (TAG) style leverages this gap deliberately: discipline from early seats, controlled aggression from late ones. Every column in the chart reflects this positional logic.
Standard Poker Preflop Charts use color zones to define your action at a glance. Green marks open-raising hands, red signals a fold, and blue or yellow identifies 3-betting candidates based on position and opponent tendencies. Training your eye to process these zones instantly removes hesitation from your game. Once color recognition becomes automatic, execution follows without second-guessing.
Suited holdings generate roughly 3–4% more equity than their offsuit equivalents because of flush draw potential. That gap explains why J♠9♠ earns a spot in opening ranges while J♦9♣ gets folded. The chart encodes this distinction into every row — overlooking it is a low-visibility leak that compounds across thousands of hands.
GTO (Game Theory Optimal) is the mathematical engine powering every legitimate preflop chart. It constructs ranges that remain unexploitable — even opponents who know your tendencies can't generate profit against a balanced strategy. Solvers have mapped optimal ranges for every position and stack Poker Preflop depth, and preflop charts translate that data into table-ready decisions.
Your open-raising range is a deliberate selection built on equity math, not guesswork. GTO analysis confirms that loading your range with weak starting hands bleeds expected value hand over hand. Solver-derived charts balance your range — strong enough to extract value, varied enough to stay unpredictable. UTG in a 9-max game opens roughly 13–15% of hands; the button widens to 45–50%.
Charts vary significantly by position. Here is how opening frequency and aggression shift across the table:
|
📍 Position |
🃏 Open range % |
🎯 Example hands |
⚡ Aggression level |
|
UTG |
13–15% |
AA–77, AK–AJ, KQ |
🔴 Very tight |
|
MP |
18–22% |
+66, ATs, KJs |
🟠 Tight |
|
CO |
28–32% |
+55, A9s, KTo |
🟡 Moderate |
|
BTN |
45–50% |
+22, A2s, Q9s |
🟢 Wide |
|
SB |
35–40% |
Adapts to BB style |
🔵 Adaptive |
Blind vs blind dynamics are among the most consistently misplayed spots in poker. You've already invested chips, which shrinks your fold equity and tempts weak defends with marginal holdings. GTO hand charts define exact calling and 3-betting frequencies from the big blind based on raise size and the opener's position. Defending too wide leaks chips; defending too tight surrenders equity you've already committed.
Static charts don't account for every format, and applying them without context is its own mistake. Shazam Casino runs both tournament and cash game tables, each demanding different preflop calibration. Knowing when to follow the chart and when to consciously deviate is the skill that converts a mechanical player into a profitable one.
In cash games, your stack stays stable in big blinds unless you rebuy — post-flop play stays deep and speculative hands retain value. In MTTs, rising blind levels compress your stack sizes (BB) and change the math entirely. With 20BB, open-shoving becomes correct for hands you'd raise-fold at 100BB. Deep stacks allow suited connectors into your range; short stacks demand push-or-fold logic and nothing in between.
GTO sets your baseline, but readable opponents justify deviation. When a player folds to 3-betting at 80%, expanding your re-raise range is mathematically correct. Directing pre-flop aggression at predictable tendencies — isolating limpers, widening steal attempts, targeting passive blinds — extracts value that a purely balanced strategy would leave behind. The chart gives you structure; the read gives you the ceiling above it.
💡 In $1/$2 USD cash games, most recreational players are either passive-loose or passive-tight. A solid TAG range with selective aggression outperforms pure GTO play against both types.
Best poker hands preflop charts are calibration tools, not autopilot systems. Treating them as rigid scripts makes your game mechanical and exploitable; ignoring them entirely means relying on untested intuition. The goal is to internalize the chart's logic so deeply that it functions as instinct, not a reference card you consult mid-hand.
Every chart assumes an average opponent in a neutral situation — real tables are neither. Stack depths shift, players tilt, and pot odds fluctuate with every action. Folding AJs from the cutoff because a chart says fold in one narrow scenario, while ignoring that three players limped ahead of you, is leaving money on the table. The chart anchors your default; live reads adjust the final decision.
Player profile shapes which chart adjustments generate the most profit. Against a nit who enters pots with only premium hands, aggressive Poker Preflop stealing and quick folds to resistance is the correct response. Against a maniac playing 60% of hands, tighten your range and let their aggression funnel chips into your value holdings. The chart builds the foundation; opponent reads determine where you build above it.
💡 Keep a mental note on frequent opponents. If someone folds to steals over 75% of the time, add roughly 10–15% more hands to your BTN and SB raising ranges specifically against them.